


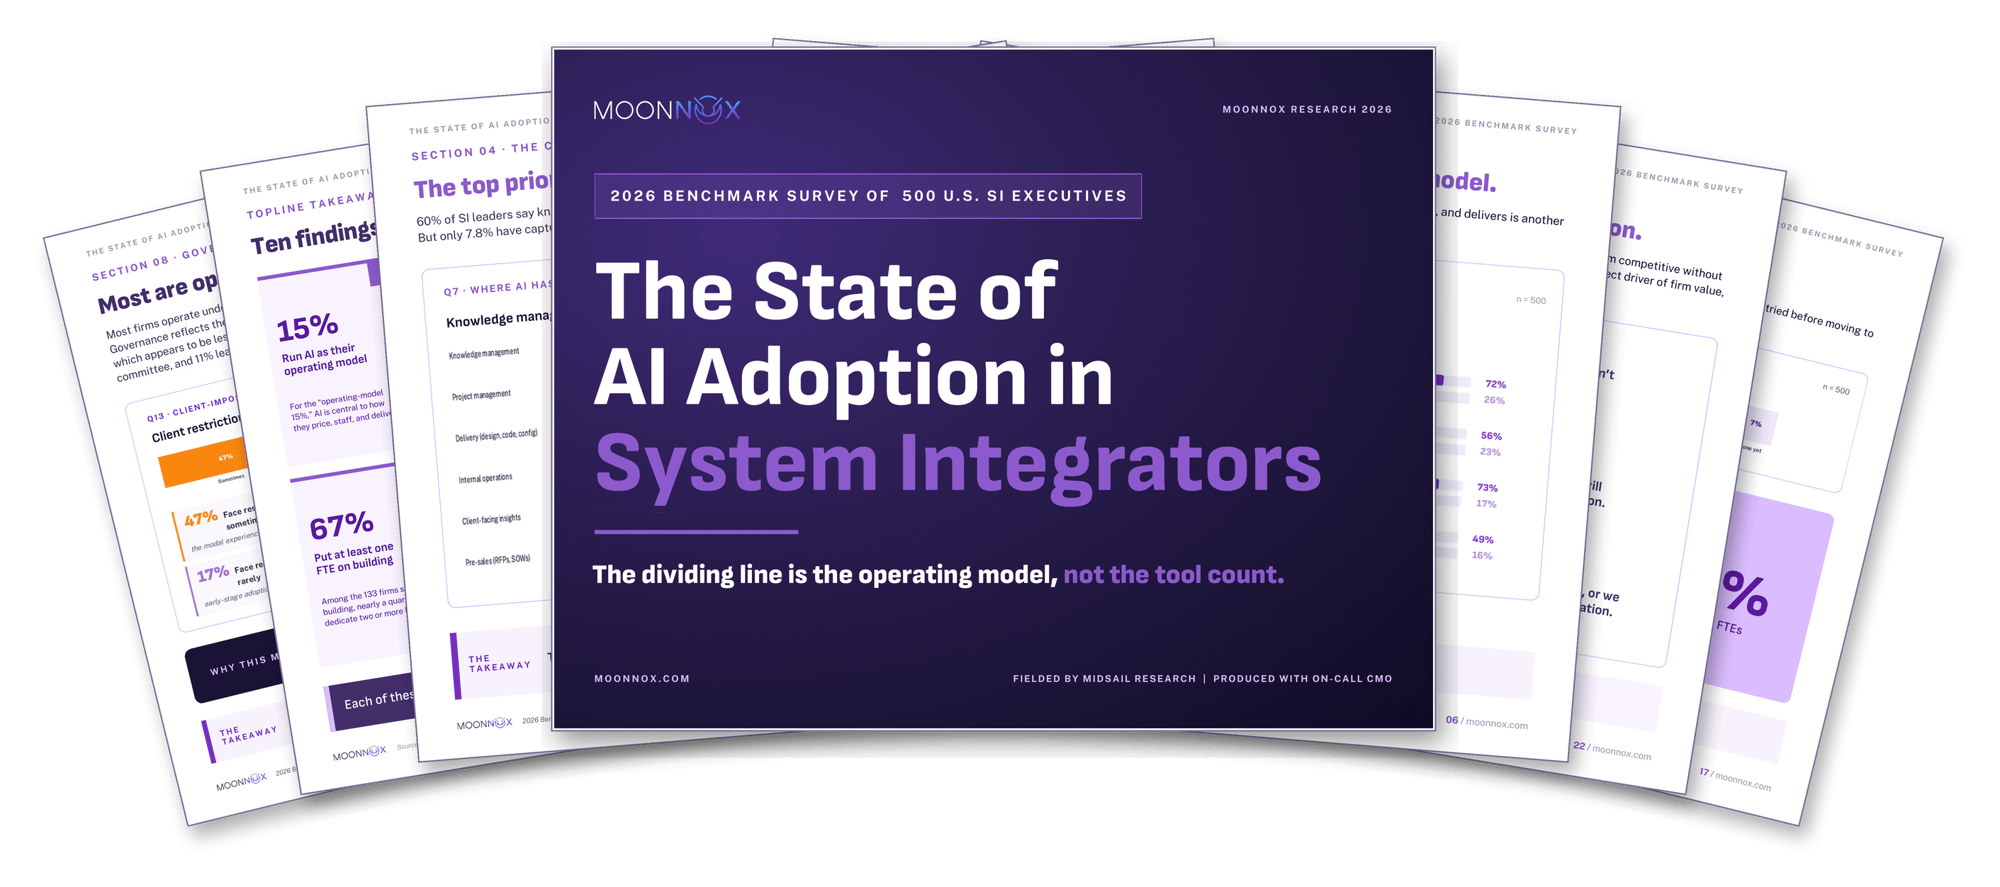
A clear gap separates the SIs turning AI into competitive advantage from those who aren’t.
In the first benchmark of its kind, we surveyed 500 system integrators on AI. 91% are using it, but only 15% are turning it into real margin, knowledge, and firm value. The data shows what sets them apart.
In early 2026, we surveyed 500 U.S. mid-market SIs to find out how they're using AI, how it's reshaping their business models, whether any of it is showing up in firm value, and what they've learned about building versus buying their AI tooling.
What we found is that AI adoption is nearly universal—91% of firms are working with AI in some capacity—but adoption turns out to be the easy part. Look past the tool count to which firms have made AI central to how they price, staff, and deliver, and the field narrows to 15%. That gap is where the economic story lives: the 15% capture margin, retain knowledge, and grow firm value in ways the rest of the market does not, and the advantage holds whether a firm has 40 employees or 3,400, and whether it's bootstrapped, capital-backed, or heading for an exit.
The full report ranks ten key findings by economic consequence. These four are where the money is.
Adoption is nearly universal across the mid-market, but value capture is not. Each finding below points to a revenue, margin, or valuation lever a leader can pull inside twelve months, and each one is a different read on the same pattern.
1) The same 15% of firms top four separate outcome metrics.
The Operating Model Dividend: Only 15% of mid-market SIs reported moving AI out of the tool layer and into how they price, staff, and deliver. When asked about EBITDA, protected margin, ROI discipline, or knowledge retention, the same firms top every list. The gap between them and the firms that stopped at tool deployment runs 30 to 45 points, and it holds whether the firm has 41 people or 3,400.
.png?width=610&height=233&name=figure-1-operating-model-dividend%20(1).png)
Figure 2. Demand for knowledge management against the share of firms that have actually solved retention. Source: Moonnox / Midsail Research, 2026 Benchmark Survey (n=500).
2) 60% say knowledge management is where AI matters most, but only 7.8% are capturing it.
The Context Gap, Quantified: SI leaders named knowledge management as the single area where AI matters most, ahead of delivery, project management, and pre-sales. Then the same leaders told us how much of that knowledge is actually captured and reusable across the firm. The space between those two answers is the largest single failure mode the survey found, and the firms deploying the most tools are the worst at retaining knowledge.
.png?width=610&height=233&name=figure-2-context-gap%20(1).png)
Figure 2. Demand for knowledge management against the share of firms that have actually solved retention. Source: Moonnox / Midsail Research, 2026 Benchmark Survey (n=500).
3) Half are building AI tools. The most common result is abandonment.
The Build Trap: More than half of SIs reported trying to build internal AI tooling or is still trying. The single most common response to how firms approach AI tooling is not a strategy, it is a documented abandonment: built it, hit the wall, moved to a third party. The firms still on that path are paying for it in billable capacity, not just budget, because the people maintaining undifferentiated infrastructure could be on client work instead.
.png?width=610&height=277&name=figure-3-build-trap%20(1).png)
Figure 3. How firms approach AI tooling, with the share of active builders dedicating an FTE or more. Source: Moonnox / Midsail Research, 2026 Benchmark Survey (n=500).
4) 61% feel margin pressure from AI. Only 21% have changed how they price.
Margin, Pricing and the T&M Shift: Most firms reported knowing that time-and-materials is exposed the moment AI starts compressing the hours, but most have not moved. A firm that uses AI to deliver faster without re-pricing is paying for the AI investment and handing the saved hours straight to the client. The firms that broke the pattern at any scale almost all changed their pricing model first.
.png?width=610&height=233&name=figure-4-margin-pricing%20(1).png)
Figure 4. Margin pressure reported against pricing-model change. Source: Moonnox / Midsail Research, 2026 Benchmark Survey (n=500).
And that’s only four of ten…
The full report ranks all ten key findings by economic consequence, completed with charts and cross-sections. We’ve also included a four-stage maturity model that maps the path between where a firm is and where the margin lives.
Download the full report by submitting the form on this page.